Trade with Confidence Using the Bulls ‘n Bears Trading System
Award Winning Proprietary Color-Coded Trading System
Experience Track ‘n Trade’s Proprietary Red Light, Green Light Trading System!
Advanced Technical Analysis Plug-in
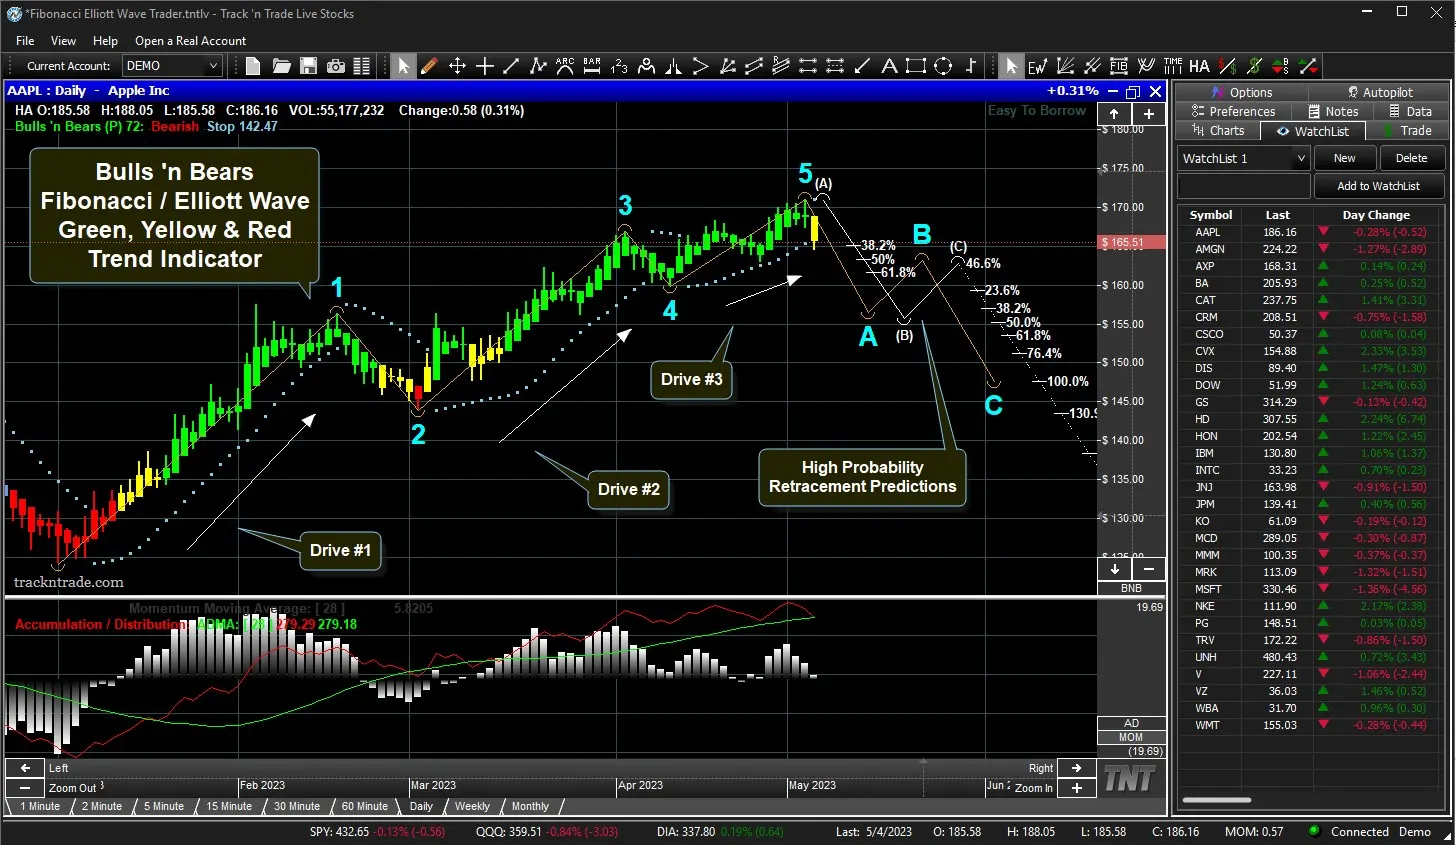
Conduct In-Depth Fibonacci & Elliott Wave Analysis
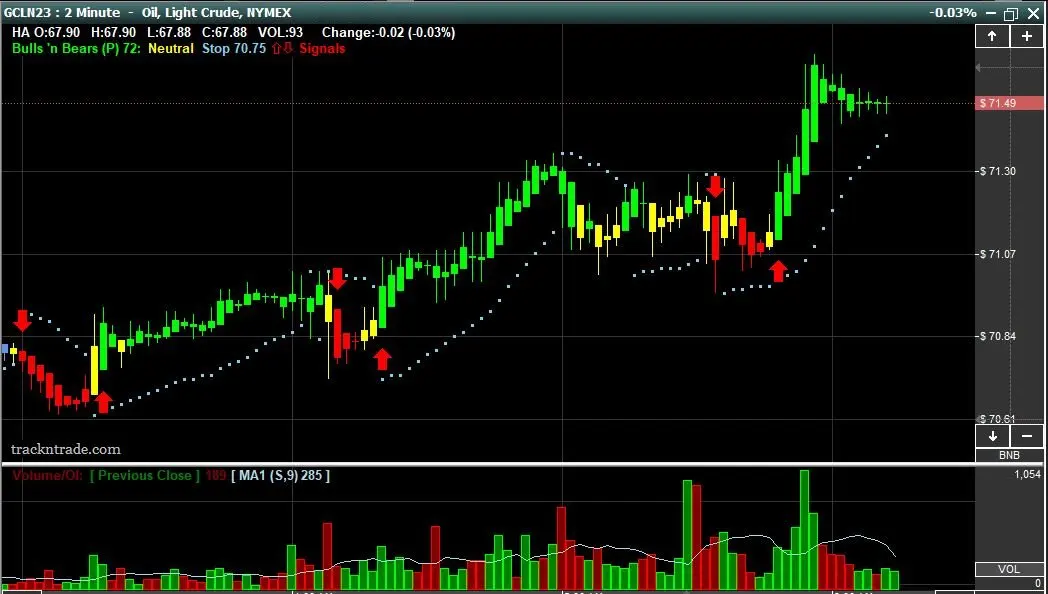
- The Red Light triggers a sell signal, indicating a possible short entry as a bearish trend begins.
- The Green Light illuminates a bullish trend, generating a buy signal for potential long entry.
- The Yellow Light is your guide to market neutrality, warning when the market enters a sideways or neutral channel.
- Leverage the power of the Blue Light Stop Placement for a hyperbolic stop that adjusts with your trades, managing risk and maximizing reward.
- Includes our Advantage Lines System for customizable early entry/exit signals, enabling you to act swiftly and decisively.
Trading Reinvented: Visualize the Pulse of the Market with Color Coded Indicators

Red Light (Bearish Trend): Indicates the beginning of a bearish trend, and that the contract has started to move downward identifying a possible short entry point.

Yellow Light (Neutral or Sideways Trend): Indicates the trend of the market has entered a sideways or neutral time frame.

Green Light (Bullish Trend): Indicates the trend of a market has begun to move upward identifying a possible long entry point.

Blue Light (Stop Loss Placement): The Parabolic stop is used within the Bulls 'n Bears system as the key point for managing your stop loss risk while trading. It helps you to identify exit and stop loss placement points after entering a trade.
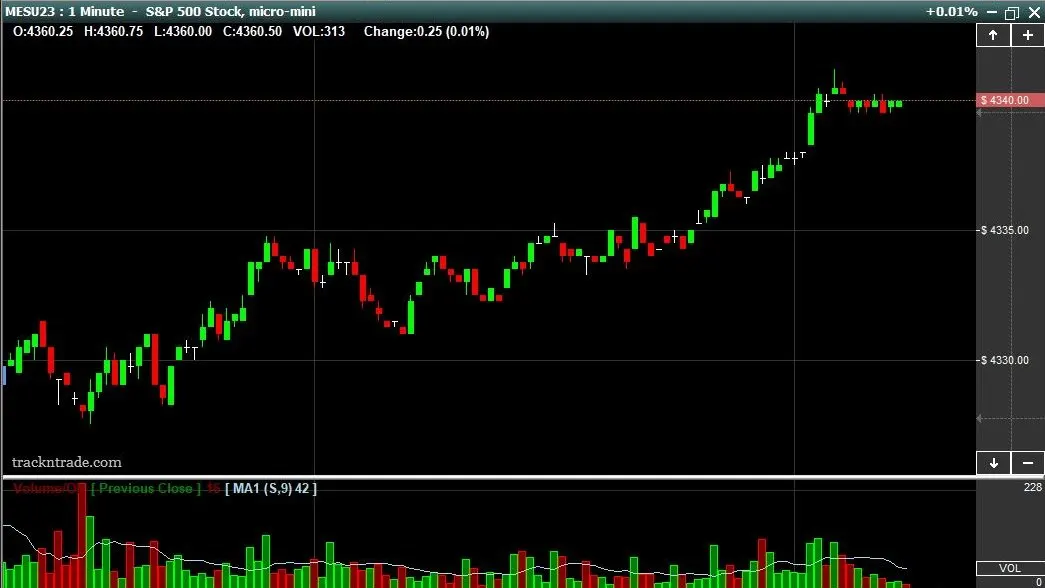
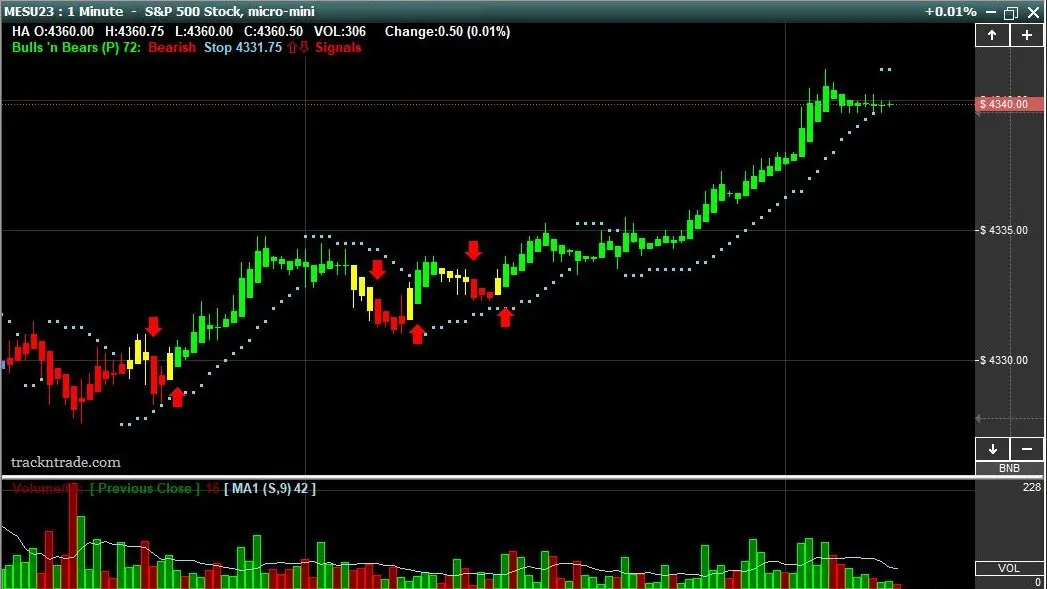
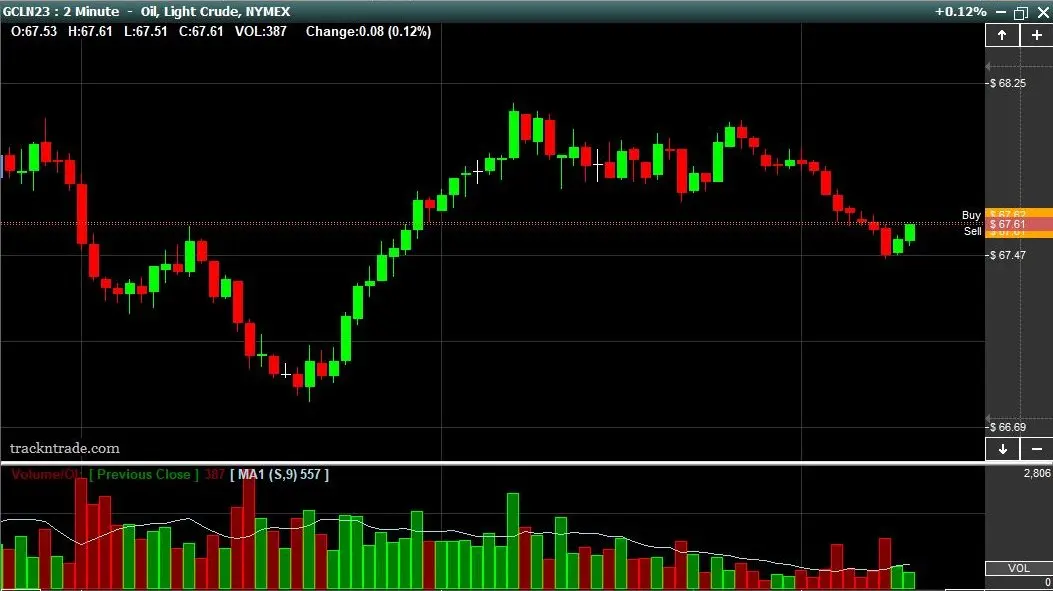
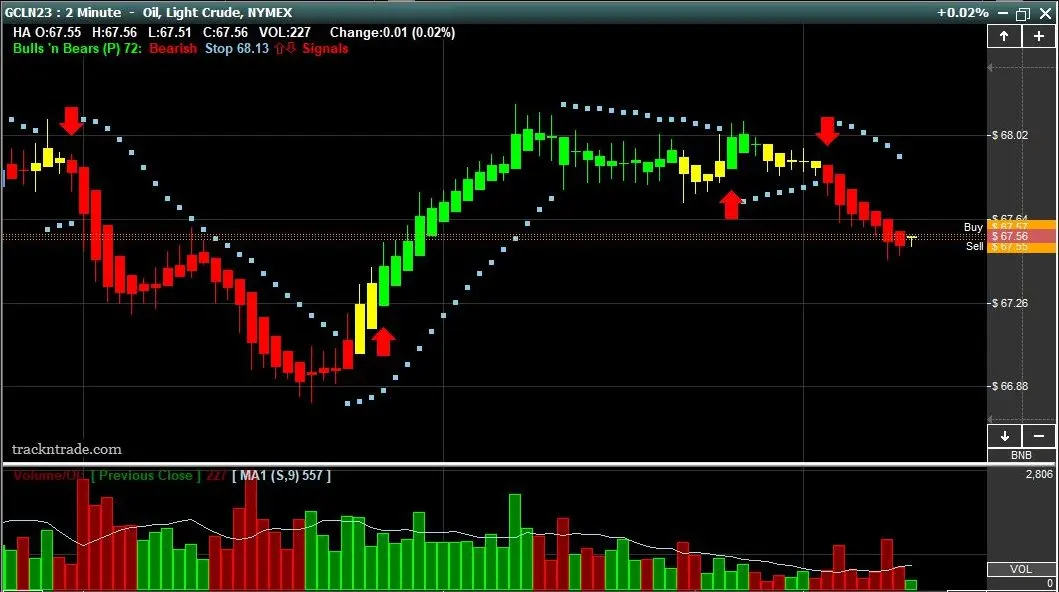
Visualize Your Advantage: With & Without Bulls 'n Bears Witness the transformative power of our innovative trading system with this side-by-side chart comparison.
Without Bulls 'n Bears
With Bulls 'n Bears
Unlock Full Trading Automation with the Autopilot Plug-in!"
Unleash the power of automation in your trading strategy with our Autopilot Auto-Trading plug-in for Track 'n Trade. The Autopilot can execute trades, manage stop/limit orders, and adjust trailing stops according to any system or indicator you choose - including our proprietary Bulls 'n Bears. This allows you to trade efficiently and consistently without being tied to your screen, freeing up more time to strategize, or take a nap, and less time worrying about execution.*
Track 'n Trade Bulls 'n Bear Plug-in
Free 14-Day Trial
Got Questions? (435) 752-8026
Works With:
Windows 10 & 11
Mac running a Windows emulator
such as Parallels, Bootcamp VMWare, VirtualBox, etc.
Please Review Your Cart Details
item(s)