Unleash the Power of Elliott Wave Analysis with our Award-Winning Trading Software
Ride the Waves of Advanced Elliott Wave Analysis

Discover the Power of Elliott Wave Analysis with Track 'n Trade
Discover Track 'n Trade's advanced Elliott Wave tools: Let Track ‘n Trade elevate your trading strategy to new heights. Whether you prefer manual chart analysis or mathematical automation, our software offers a comprehensive range of tools to cater to your unique trading style.
Automated and Mathematical Identification of Elliott Waves: For those who prefer a more systematic approach, Track 'n Trade offers the Zig Zag system. This powerful tool combines the Elliott Wave indicator with Fibonacci retracement and projection levels, automatically identifying trends and providing invaluable insights for your trading decisions.
Manual Identification of Elliott Wave Trends: With a simple click of an icon, you can effortlessly load the cursor with the Elliott Wave analysis tool and mark the highs and lows of the wave formation. Traditional chart technicians appreciate the flexibility and control our free-floating tools provide, allowing them to adjust and label points as the market evolves.
Elevate your trading strategy with Track 'n Trade: Cutting-edge Elliott Wave tools unlock the potential of this powerful analysis technique.
Experience the Power of Automated Elliott Wave Analysis
Track 'n Trade's Zig Zag system: Unlocking the potential of Elliott Wave analysis has never been easier. By simply toggling the sensitivity level using our intuitive slider interface, the software automatically identifies Elliott Wave trends and generates corresponding Fibonacci projection and retracement levels. You have complete control to customize the level of sensitivity to match your trading preferences.
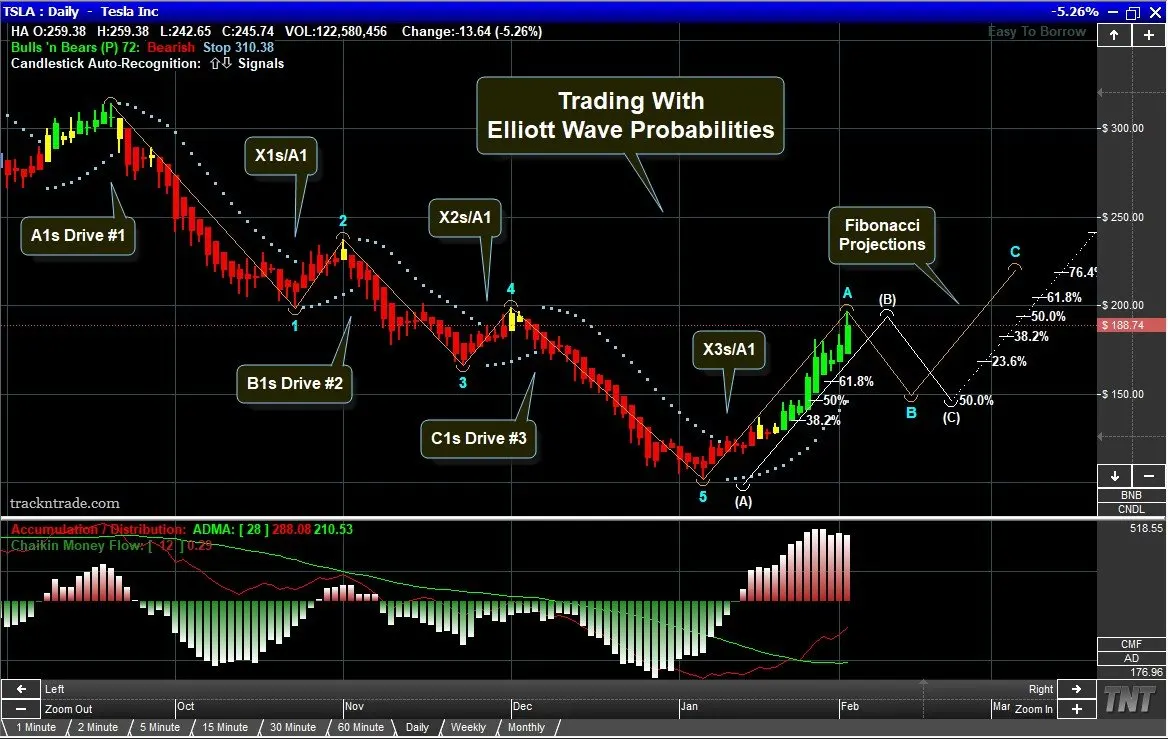
Color-Coded Visualization for Simplified Analysis: Take advantage of our Bulls 'n Bears Trading System, a comprehensive tool that integrates Fibonacci, Elliott Wave, price, and time projections into one simplified trading system. We have done the complex calculations for you, presenting the relationships between these systems in an intuitive color coded format. Green bars indicate Fibonacci and Elliott Wave projection levels, red bars represent retracement extension levels, and yellow bars highlight neutral points between the two. This visual approach ensures easy understanding and interpretation of key levels.
Leverage Track 'n Trade's automated analysis tools: You can confidently navigate the intricacies of Elliott Wave analysis, gain valuable insights, and execute well-informed trading decisions.
Maximize Your Trading Potential with Autopilot and Elliott Wave/Fibonacci Integration: Imagine harnessing the power of Track 'n Trade's Autopilot automated trading system to execute your Elliott Wave and Fibonacci-based trading strategies with precision and efficiency. Our advanced technology seamlessly integrates these powerful analysis tools, allowing you to automate your trades based on the generated Elliott Wave and Fibonacci levels.
- With Autopilot, you can define your entry and exit rules, set profit targets, manage risk with stop-loss orders, and even customize your trading parameters. The system will automatically monitor the market, identify optimal trade opportunities based on the Elliott Wave and Fibonacci projections, and execute trades on your behalf. You can have peace of mind knowing that your trading strategy is being executed consistently and without emotion, even in fastmoving markets.
Combine speed and efficiency with Track ‘n Trades set-it-and-forget-it Autopilot: Auto-trading with the accuracy of Elliott Wave and Fibonacci analysis; unlock new levels of trading action. Let Track 'n Trade's integrated solution take your trading to the next level, allowing you to focus on strategic decisions while the system handles the execution with precision and reliability.
Track 'n Trade stands in a league of its own: With a rich array of features and unparalleled functionality, it is the ultimate tool for traders seeking to unlock their full potential. From manual analysis to automated calculations, Track 'n Trade empowers you to make informed trading decisions and seize profitable opportunities.
- But that's not all - Track 'n Trade offers so much more than what we've covered here. Don't miss out on the chance to explore the full capabilities of this remarkable software. Download your free trial copy of Track 'n Trade today, with no cost, obligation, or credit card required. Install the software and embark on a journey of discovery as you witness firsthand the power and precision of "Track 'n Trade, The Ultimate Elliott Wave Trading Machine."
Don't settle for anything less than the best: Elevate your trading experience with Track 'n Trade, the seven-time award winning software, and unleash your trading potential like never before. Get ready to take your trading to new heights with the Cadillac of Elliott Wave and Fibonacci trading software.
Advanced Strategies Like Fibonacci
Track 'n Trade is also The Ultimate Fibonacci Trading Software, see the demo video.
Unlock Your Trading Potential Today
Track 'n Trade Elliott Wave Trading Software
Free 14-Day Trial
Got Questions? (435) 752-8026
Works With:
Windows 10 & 11
Mac running a Windows emulator
such as Parallels, Bootcamp VMWare, VirtualBox, etc.
Please Review Your Cart Details
item(s)